


We’ve talked a lot about polling misses in our recent posts, and how they could affect our 2026 midterm prediction. Many Americans and international observers have little faith in the polls, especially since they show an abnormally strong performance for Democrats.
For that reason, I compiled a list of five alternative indicators for the 2026 midterms, along with ratings of which party each indicator favors and how accurate it is.
1. Primary Turnout
Indicator Lean: Strongly Favors Democrats
Indicator Strength: Moderate Accuracy
Millions of voters already went to the polls this year to cast ballots in the Democratic or Republican midterm primaries. With the November election still months away, analysts and political commentators took a closer look at these primaries for any possible indication of how the 2026 midterms would go.
The idea is easy. One compares the number of votes cast in the Democratic primary with the total voter turnout in the Republican Primary. Record Democratic showings further fueled this practice. In Texas, Democrats outvoted Republicans for the first time in a non-presidential in decades. Across the South, primary turnout surged among African American Democrats, who were likely enraged by the Supreme Court’s decision to dismantle large parts of the Voting Rights Act of 1965.
While primary turnout tells us a lot about base excitement, it doesn’t have to be indicative of future performance. Most party primaries across the US are closed to either registered Democrats or Republicans, meaning Independents – who make up the largest & growing share of the electorate – are being left out. Primary turnout doesn’t help us predict crossover appeal.
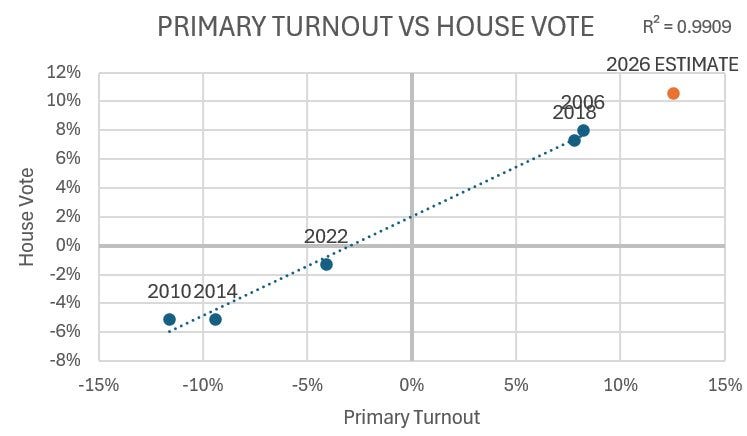
Still, primary turnout rates can be an indicator for the general election. An analysis of nationwide primary turnout and election results in past midterms shows a damning picture for the GOP, predicting a D+10 to D+12 year. The graph below only includes a few data points, but should the 2026 results fall within this range, primary turnout might become a popular indicator.
2. Early Voting
Indicator Lean: Favors Democrats
Indicator Strength: Moderate Accuracy
Early voting is one of my personal favorite indicators. Not necessarily because of its accuracy (which is debatable), but because it’s fun and you are looking at real data from people who already cast a ballot in the election you are trying to analyze.
How indicative early voting data can be of the November election results depends on two things. First, the state. Each state’s electorate votes differently. In states like Nebraska, about 60% of voters cast their ballots on Election Day. In Georgia or Florida, a clear majority votes early, either by mail or in-person, creating an opportunity for a decent analysis. The information about who voted differs from state to state. In Florida and Georgia, we know how many registered voters of each party cast ballots, but in Virginia, we have no data about the party registration of voters.
This brings me to the second factor: The model you use. Dave Trotter from Voting Trend uses a model that centers around geography. Where are the votes coming from, and how does that place usually vote? His ranges represent a nowcast, not a forecast, but comparing them to his nowcasts of past elections (2024, 2025) can help one understand which base is turning out in greater numbers.
VoteHub’s early vote models analyze party registration and detailed voter file data to calculate what they call a turnout boost (difference between 2026 electorate and the 2024 recall vote). Another helpful insight they provide is an analysis of voting behavior of low- and high-propensity voters. In 2024 early voting, Democrats blew through their high-propensity voters (voters who voted in all past 3 elections), masking a weakness with low-turnout voters in the toplines.
What about 2026? Virginia offers the most expensive data. Almost 500,000 people have already voted in the state. According to StateNavigate’s model, the early vote electorate is shaping up to be about 4 points bluer than 2025, when Democrats won in a landslide.
3. Gallup’s Party Identification
Indicator Lean: Strongly Favors Democrats
Indicator Strength: High Accuracy