


With a forecasted D+9.5 generic ballot, the national environment will shift 11.1 points to the Democratic Party compared to 2024. Still, the US will not shift uniformly to the left on Nov. 3rd, and differences will vary widely across districts. Democrats are competitive and even favored in districts that are far to the right of Trump+11, such as Texas’ 15th district (Trump +18). At the same time, Republicans are doing well in districts that Trump carried by a smaller margin.
Incumbency effects can explain some of these differences. Republican Brian Fitzpatrick is still favored to narrowly win PA’s 1st district, even though it voted for Harris by 0.3 points in 2024. But the biggest factor driving these uneven shifts in all 435 districts is undoubtedly race1.
Hispanic voters became the story of the 2026 election months ago. They swung heavily towards Trump in 2024, but persistent inflation and ICE overreach have led to a historic reversal. Democrats might even match their 2020 performance with Hispanics across most of the US, though polls indicate they still lag behind their 2018 showing.
The reversal is why districts with large Hispanic populations are projected to swing harder left than other districts. According to The Argument’s numbers, Hispanics will shift at a rate of 1.6x the generic ballot.
Hispanic Voters Move Forecast in Democrats’ Favor
For this analysis, I compared two versions of my House forecast model. One is the fundamental baseline, which includes the district’s partisan lean, incumbency effects, and the generic ballot. The second version includes the next layer: demographics. Using Household Income and race, the model calculates how much the generic ballot will shift in each district, based on the Argument’s extensive data for each subgroup.
Data bite: Republicans are pulling money out of IA-1st and NJ-7th, signaling a lack of confidence that they can defend the two seats.
The individual findings are pretty clear, but the income and race layers often even themselves out: Heavily black districts shift less to the left because they are already voting overwhelmingly Democratic, but poor districts will shift to the Democrats at a higher rate. Southern majority-black districts with low income therefore barely shift at all. An example: If we apply data for race subgroups on Alabama’s 2nd congressional district, it shifts 2.2 points to the right, but after accounting for income, the shift gets diluted to 0.3 points.
What about Hispanic voters? When controlling for other racial demographics and household income, a district’s Hispanic share is the single largest demographic driver in the shift of the forecast layer, accounting for almost 40% of the model’s total explanatory power, far ahead of any other subgroup.
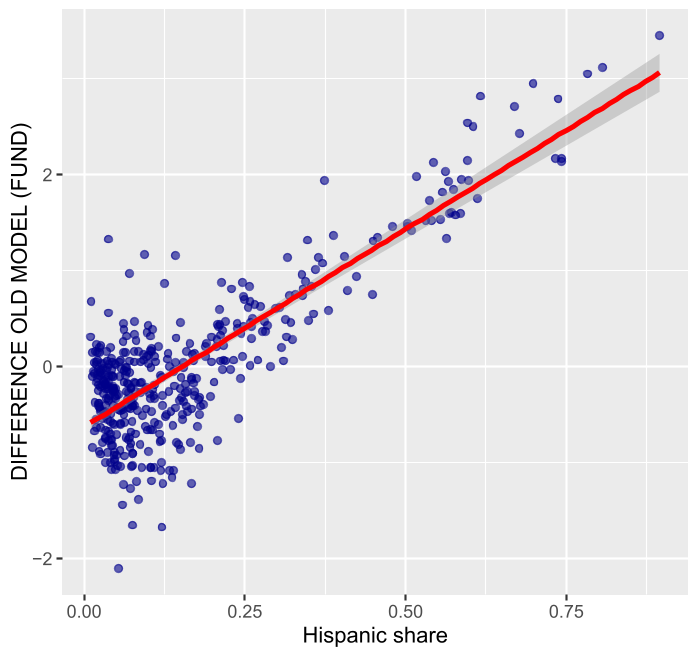
When analyzed in isolation, we get a similar result. The shift between the two fundamental baselines (pre-demographic layer → post-demographic layer) in a district is closely related to the district’s Hispanic voting-age population (r=0.83). Almost 70% of the variation in the model shift is explained by a district’s Hispanic share when the variable is analyzed in isolation. In most districts, the Hispanic shift drowns out shifts by other race and income groups. Of course, including demographic shifts is an imperfect approach to fine-tuning a forecast model. Hispanic voters are a diverse group and vote vastly differently depending on their country of origin. While I believe all Hispanics will shift left, there might be a significant gap as to the extent of said shift.
No other subgroup, race, or income is as significant in its influence as Hispanic voters, but it’s worth looking at the differences. Democrats underperform the national average shift in white and wealthy districts. They do better in low-income districts. They underperform their national shift in black districts as well, but those are mostly Safe Democratic districts anyway, and turnout will play a crucial role in key races in the Deep South.